Reports & Analytics

Narrated analysis from your own data.

Upload a dataset, describe what you want to understand, and Reports & Analytics recommends a method, runs it and writes a narrated report you review before it saves.

What it does

The data already exists. The answers do not, because getting them has meant an analyst who knows both statistics and your operation. Reports & Analytics is the data intelligence and analysis engine inside OpCor. Upload a dataset and AI infers the schema, proposing a dataset name, type, project and description for your review before it saves.

Describe the question you want answered, and the system matches it against a set of known analysis intents and recommends a method: trend, variance, anomaly detection, forecast, or a correlation-based read. Run the analysis, and a model writes a narrative from the summary statistics. It is the shared engine behind the Forecast view in Perform, so the same analysis math is available there too.

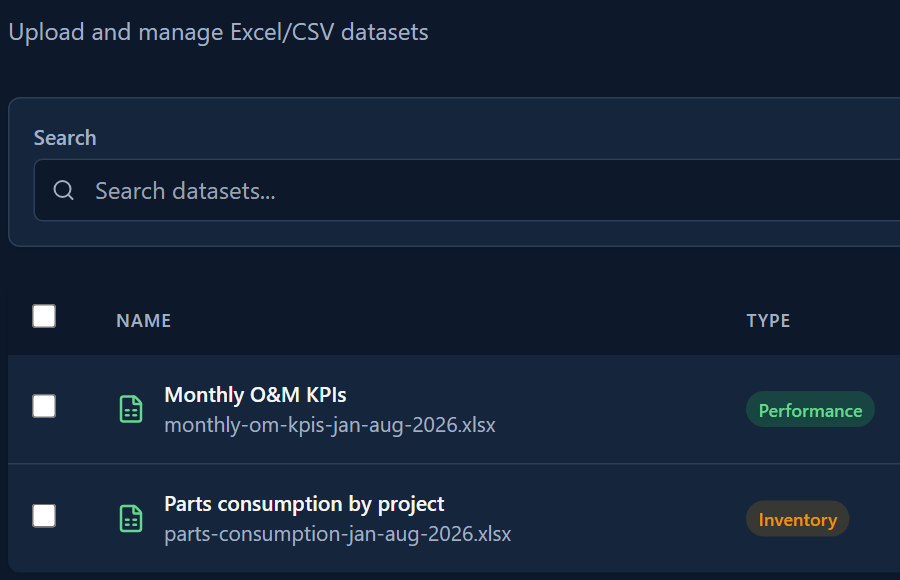
A dataset search lists two uploaded spreadsheets tagged performance and inventory.

How it works

  1. 01

    Bring your data

    Upload a file. AI infers the schema, column types and anomaly candidates, then proposes a dataset name, type, project and description for your review before the dataset saves.

  2. 02

    Describe your objective

    Type your analysis objective in plain language. The system matches it against a set of known intents and recommends a method.

  3. 03

    Review the recommended method

    The resolver suggests an analysis method, a template and a rationale. You can pick a different method before running it.

  4. 04

    Get the report

    Run the analysis, generate the narrative, then build the report, each a separate step. The narrative is model-written from summary statistics.

  5. 05

    Save and reuse

    Save a report configuration as a template for recurring reporting needs.

  6. 06

    Archive

    Download or store a generated report in Library as part of your operational record.

Use cases

Correlation read across logs (industrial maintenance)

A manufacturing plant has seen a rise in unplanned downtime over two quarters. The reliability engineer uploads maintenance logs and asks what's driving the increase on a line. Reports & Analytics runs a correlation read across the uploaded data and returns a narrated report naming the strongest relationships in the data.

Budget variance reporting (construction)

A project controller managing several active construction projects needs monthly budget-versus-actual reporting. The controller uploads cost data and asks for a variance read. The system returns a per-row comparison of actual against expected cost, narrated in plain language.

Equipment performance trends (utilities)

A utility operations manager wants to understand transformer performance across substations over time. The manager uploads the equipment data and asks for a trend read grouped by an existing field like substation age. Reports & Analytics returns a narrated trend analysis grouped by that field.

Workforce utilization analysis (field service)

A field service company wants to understand utilization patterns. The operations director uploads dispatch and timesheet data and asks where hours are going. The report returns descriptive statistics, narrated, on the uploaded columns.

AI capabilities

Dataset schema inference

Upload a file and AI proposes a dataset name, type, project and description. Review the proposed metadata before the dataset saves.

Objective-first method matching

Describe what you want to learn in plain language. The system matches your objective against known analysis intents and recommends a method.

AI-narrated findings

Generate Insights writes a narrative, findings, implications, recommendations and outlook, from summary statistics. The narrative appears in the PDF executive summary.

Method library

Eleven analysis methods are available, including trend, anomaly detection, forecast, variance and correlation-based reads.

Reusable report templates

Save an analysis configuration as a template for consistent structure across reporting periods.

Value and integration

What you gain

  • ▸Reports are assembled from recommended methods instead of a guessed approach.
  • ▸Findings are returned as a written narrative, not only charts and tables.
  • ▸A saved report configuration keeps structure consistent across reporting periods.

How Reports & Analytics connects to OpCor

  • ▸Perform: Reports & Analytics is the shared engine behind the Forecast view in Perform, where it runs on a single metric's recorded readings.
  • ▸Library: Generated reports are stored in Library as durable records.

See Reports & Analytics running

Tell us what you want to see in Reports & Analytics and pick a time that works for you. On the call we listen to your questions, then show you OpCor running on what you picked.